The anatomy of a Revend message
Each Revend notification tells a story. This page provides a complete walkthrough of the seven key parts, so you can interpret alerts as effectively as possible.

Starting off: When do you get a Revend notification?
A Revend notification is only fired when the monitoring picks up a strong, enduring deviation from what is normal activity on your store. Both the sensitivity and the warmup time before a notification is fired are automatically adjusted as Revend learns from your store's behaviour. As a user, you can also set these settings manually to match your requirements.
Below are the 7 key components of a Revend notification.
Part 1: The Incident

The first thing you read
An incident was detected by Revend, and made it through our filters into your channel. Revenue might be at risk, and you are the person we notified to investigate further.
When does Revend raise an alert?
Revend raises an alert when we have detected at least 2 consecutive 1-hour intervals where a metric has acted abnormally. A new interval is produced every five minutes with a summary of all events in the last 60 minutes. So if you get a new alert, that means we have looked at all events in the past 65 minutes before reporting.
- When the incident was just detected, the message will start with “New incident detected”.
- When the incident was already open but has been going on for more than 5 minutes since the last update, the incident will update and the message will start with “Ongoing incident”
- When the KPI is back into normal operating range, the status bar will turn from red to green (see next title), and the message will start with “Incident resolved”
Part 2: The Status Bar

How can I tell if an incident is resolved or still active?
- A red bar means the incident is still affecting your website, and the KPI is still not back to normal levels
- A green bar means the incident is no longer affecting your website, and the KPI is back within the expected range for normal operations
So, does a green bar mean I don’t have to worry or investigate?
No. While it does mean the matter is no longer super urgent, meaning you are probably no longer losing conversion due to it, it will still have impacted your figures during the reported timeframe. See part 4 on how to investigate the issue and report back to Revend whether this was an actual problem or a false positive.
Part 3: The Details

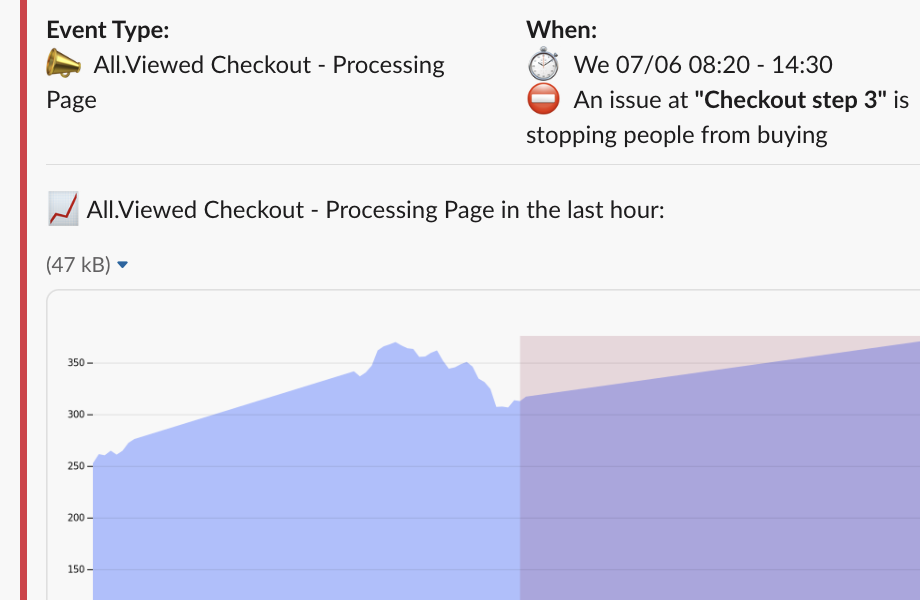
- 📣 Event type: What event is under scrutiny? This can be each event you are tracking, including custom events. (e.g. Add to cart, checkout, product page views)
- ⏱️ When: Over what period of time is the outlier in your KPI observed? This interval auto-updates for every 5 minutes the incidents persists. Remember that we look at 1 hour of data for every data point, so if an alert has been open for 5 minutes, this means we have looked at 65 minutes worth of data.
- 📉📈📊 Model metrics: These four figures tell you what value we observe (current) and what Revend's models estimate as normal behaviour of your KPI based on the historical behavior of that KPI.
Part 4: The Feedback Buttons

Pressing the right button today can save you days of revenue tomorrow 💰. It makes your version of Revend smarter each time you do it. Before pressing either of these buttons, make sure you know what to confirm first.
How can I confirm if the incident Revend detected is an actual problem?
- Check Google Analytics' e-commerce reports. (Only possible 4 hours later, as GA data is not available in real-time)
- Check your own metrics in the store back-office (e.g. are your sales down in Shopify compared to the same time last week?)
- Try placing an order in your store, pay for it, and refund yourself later. Ideally, do that for every payment method if the first one you try didn't fail. (Only if both of the above failed)
After doing this this, use the feedback buttons to train Revend and make your alerts smarter.
✅ Confirm issue
When to use it
Press this button when you have received the notification and confirmed that it detected an actual problem.
What happens when you use it
- Right Now: Revend will ignore this timeframe for the KPI involved when training the model - meaning we won’t use a problematic period when trying to define what “normal” looks like for your shop.
- Near Future: This data point will be used when comparing different models and their parameters for your shop to determine which combination catches the most confirmed issues and doesn’t trigger too many false alerts. In plain English, this means that Revend will get better over time at knowing how your store works the more you use this feature. 🏆
⭕ Report as false positive
When to use it
Press this button when you have checked the issue, and confirmed that it did not detect a real problem. This means you have done the research outlined above, and did not see any problems when confirming all of the 3 possibilities above. It will be counted as a hard false positive.
What happens when you use it
- Right now: You’ve helped us develop Revend further by providing a data point with which we can evaluate new modelling techniques and improve Revend’s functionality.
- Near Future: Revend will retrain the models and automatically determine which combination of parameters minimises the chances of a similar situation like this being reported as an issue for your store.
❓ Don’t press any of the two messages
When to do it
If you ignore a message and don’t give feedback, Revend’s algorithm will treat is as a soft false positive. So don’t worry if you miss reporting on a notification once in a while, Revend will always take into account which messages you interact with, and adjust your model accordingly.
Part 5: Checkout Status (optional feature)

If your organisation implemented Revend’s checkout robot feature, an additional notification detail will appear in each Revend message: whether or not your checkout flow is impacted by the detected issue. There are two possible values for this detail.
- ✅ Checkout is not impacted. Our robot was able to complete your checkout flow, and people should still be able to buy your wares and services online.
- ⛔ An issue at step in your checkout flow is stopping people from buying. E.g. ⛔ An issue at Checkout step 3 is stopping people from buying. In this case, an Error screenshot link is attached at the bottom of your notification. ****
When our robot is stopped in its tracks while attempting to go through your checkout flow, it can indicate two things:
- A checkout-breaking issue is blocking your customers from checking out, actively costing you revenue and customer satisfaction. Follow up this notification with proper priority.
- Check the attached error screenshot
- Re-test the checkout yourself
- If necessary, contact your colleague(s) and/or agency contact person to follow this up immediately
- A change was made to the checkout flow that Revend’s robot is not yet aware of, making it stop in its tracks. Typical changes are additional steps (e.g. when working with a new fulfilment or logistics partner) or new pop ups (e.g. when promoting up- or cross-sells). In this case, please contact your Revend account manager, and your robot will be updated accordingly. Revend’s product team also proactively monitors ⛔ messages to make sure changes are incorporated quickly.
Part 6: Funnel Graph

The funnel graph illustrates the steps involved in making a purchase, which are divided into four parts: detail, add to cart, checkout, and purchase.Similar to a status bar, each step is represented by a color indicating whether everything is running smoothly (green), seeing some decline (yellow), or if there's an issue (red).
Additionally we have a Total Conversion Indicator, which represents the percentage of customers who successfully complete a step and move on to purchase.
Part 7: KPI Graph
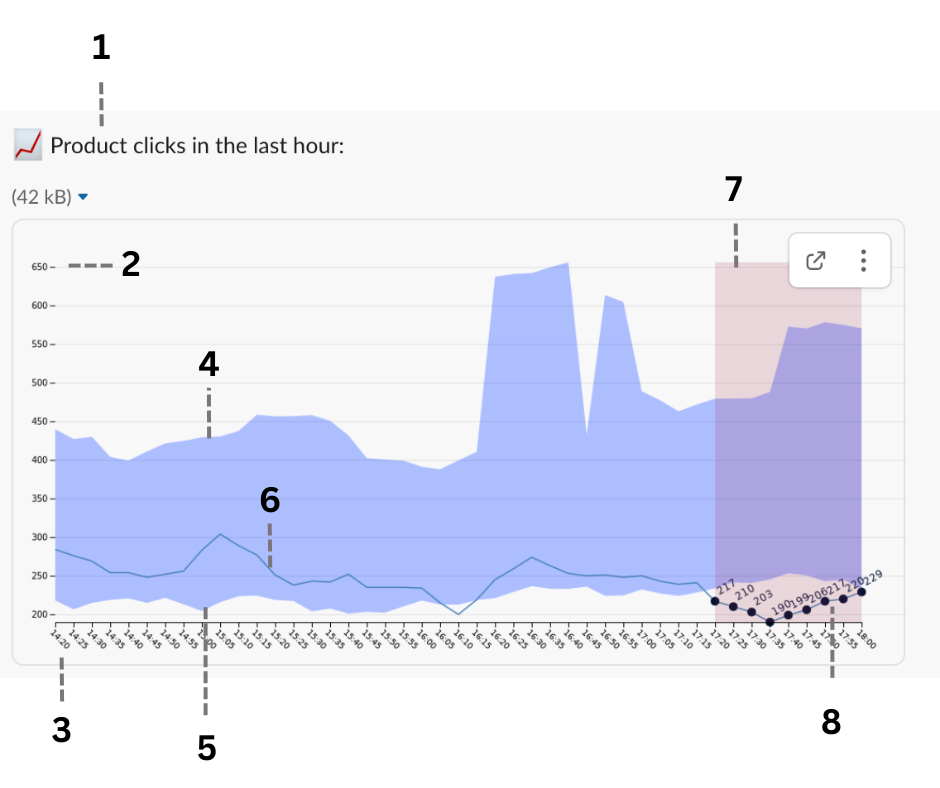
When pressing ‘see more’ or ‘read more’ - depending on whether you consult Revend via Slack or Teams - you will see one or more graphs like this.

We designed these graphs to give you a quick and clear overview of why a notification was fired, how the affected KPI metric has behaved, and what action to take next.
Here is a step by step guide on how to interpret these graphs.

- The KPI metric represented in the graph. In this case product clicks in the last hour.
- The y-axis indicates the value of the KPI metric. In this case amount of product clicks in the last hour.
- The x-axis indicates time. In this case a time period from 14h20 to 18h00 CET.
- The light blue region is Revend’s model of what is ‘normal behaviour’ of the KPI metric for your webshop over time. The upper bound is what is considered a normal maximum.
- The lower bound is what is considered a normal minimum of the KPI metric for your webshop.
- The thin dark blue line is the actual value of the KPI metric that is observed.
- When the observed value is below the normal minimum for too long (i.e. longer than the configured acceptable warmup time), Revend fires off a notification. This is the danger zone, marked in light red.
- In the danger zone, Revend highlights the individual value of the KPI metric over time. You can quickly spot how urgent the situation is, and decide whether to take action (monitor, delegate, investigate).In this case, the product clicks went as low at 190 per hour, which is significantly below the historically observed minimum of 250 for the same time period.
You are all caught up. 👍 Thanks for reading all this way and becoming a Revend-expert!
As always, team Revend is happy to quickly spot conversion stoppers while your e-commerce store conquers the world 🌍
Feel free to contact us, check out our other resources, or get started with Revend today.
P.S.: if you start using Revend, you'll be in good company. Check out these success stories to learn how you can decrease your business risk while growing fast.
Check out more
Let’s see Revend in action!
Monitor, track, and analyse data faster than ever before so you never lose sleep over your webshop again.


